WordPress plugin
Hatch Chart
An interactive fly fishing hatch chart for WordPress. Insect hatches by month, fly patterns for every life stage, field notes and natural insect reference photos.
- An interactive chart that opens on the current month and deep-links to every bug
- A visual timeline of surface and subsurface activity across all twelve months
- Life stage tabs with patterns, hook sizes and a natural insect photo for each stage
- Six insect types that change how stage labels read, from mayfly to terrestrial
- Field notes as scannable tiles, plus long-form entomology and tactics
- CSV import and export of the whole database, and full keyboard and screen reader support
Screens
Select a screen to see it larger.
-
The chart opens on the current month and shows every insect active right now. 
The chart opens on the current month and shows every insect active right now. -
Each life stage gets its own tab with hook sizes, a reference photo and patterns. 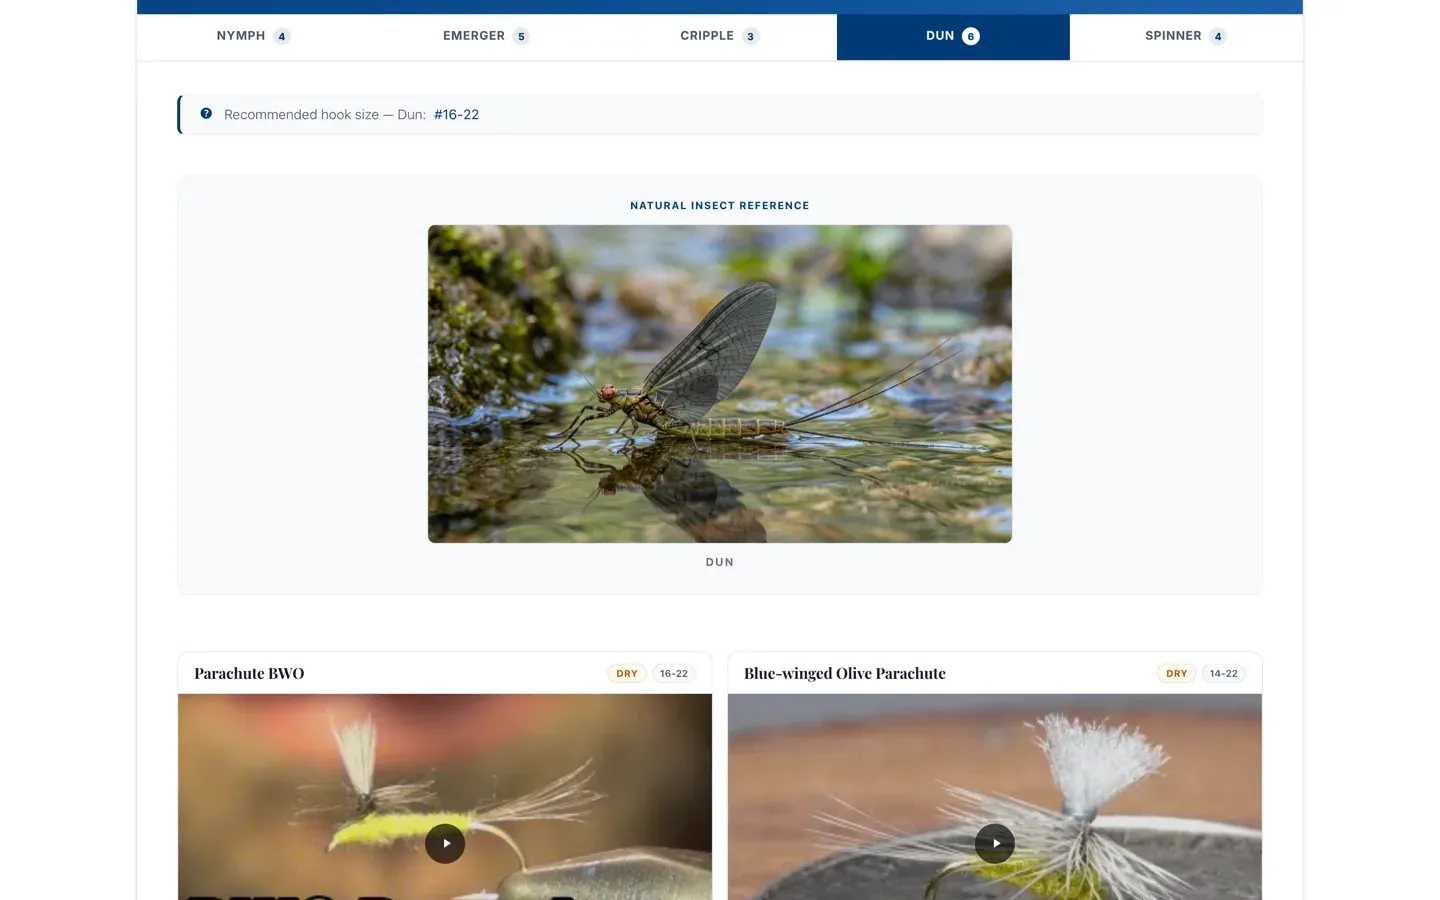
Each life stage gets its own tab with hook sizes, a reference photo and patterns. -
The full season at a glance: surface and subsurface activity for every insect. 
The full season at a glance: surface and subsurface activity for every insect. -
Field notes distill each hatch into when, why and what to tie on. 
Field notes distill each hatch into when, why and what to tie on. -
The same chart, sized for the river: browse hatches from a phone. 
The same chart, sized for the river: browse hatches from a phone.
Hatch Chart turns a WordPress site into a living reference for trout anglers, from the first midges of winter to the last hoppers of fall. A club, a guide or an outfitter builds a database of aquatic and terrestrial insects, attaches fly patterns to each life stage with tying recipes and video links, writes field notes, and uploads reference photos of the natural insect.
For visitors
The chart opens on the current real-world month, so anglers land in the right season, and bugs active right now carry an “In season” badge. Every bug and every month has a permanent link to share. A Gantt-style timeline shows surface and subsurface windows for every hatch across the year, and clicking a bar opens the full chart on that bug.
For the person maintaining it
Each hatch holds up to five life stages, each with an unlimited pattern library sorted by drag and drop, a recommended hook size, and a reference photo. Seven structured field-note fields keep the practical knowledge scannable, and long-form editors hold the entomology. The whole database imports and exports as a 28-column CSV, so a club can maintain it in a spreadsheet.
Accessibility
Stage tabs use full ARIA tab semantics with arrow-key navigation, filter buttons expose their pressed state, every interactive element has a visible focus ring, and text colors meet WCAG 2.1 AA contrast. To get Hatch Chart for your site, get in touch.
Accessibility and standards
What Hatch Chart is built and checked against, in plain words. These are our own checks, not third-party certifications. About these standards.
- WCAG 2.1 AA
- The international accessibility checklist for the web, at the level most laws point to: readable contrast, keyboard operation, labels a screen reader can read, and no meaning carried by color alone.
- Keyboard navigation and ARIA
- Everything works without a mouse, with visible focus so you can see where you are, and controls carry the roles assistive technology needs to understand them.
- Your data in open formats
- Exports come out as CSV, JSON, Markdown, PDF or RSS: files any spreadsheet, text editor or reader can open, with no need for our software.